

The short answer
A battery moves power in time
- A battery does not make power. It stores power and releases it at a better time.
- For most homes, the value is moving your own solar into the expensive evening hours.
- For many businesses, the value is trimming the single highest power spike of the month.
- "Offset" counts kilowatt-hours. Your bill counts dollars. Those two numbers can be far apart.
Your results depend on your own system size, how much your solar produces, and how much energy you use and when. No two homes or buildings behave the same, so treat every example on this page as an illustration, not a prediction.
Compare
Four ways to run a battery
The same battery can be set up to chase different goals. Which one makes sense depends on your rate plan and, for businesses, your demand charges.
| Strategy | What it targets | How it behaves | Typical fit |
|---|---|---|---|
| Self-use | Buying fewer kWh | Stores surplus solar, covers the home whenever solar falls short | Homes where exports earn less than imports cost |
| Solar-charge, 4-9 pm | The expensive evening window | Charges only from solar, holds the energy, discharges 4-9 pm | Homes on a plan with a 4-9 pm peak |
| Grid + solar (arbitrage) | The price spread | May also top up from the grid when rates are lowest | Wide gap between cheap and peak rates |
| Demand control | Kilowatts, not kilowatt-hours | Discharges only enough to cap the highest spike | Businesses billed on peak demand |
System size meets usage
Your roof sets a limit. Your usage sets the offset.
A bigger roof can allow more panels, but the total roof area is not all usable. Shading, vents, access paths, required setbacks, and structural and electrical constraints affect the layout; a site-specific design establishes how many panels can fit and be approved (DOE solar planning guidance).
That permitted panel layout determines the system size used to estimate annual solar production. Comparing the production estimate with your annual electricity use gives the energy offset; roof size alone does not determine the percentage (DOE system-sizing guidance).
Solar energy offset = estimated annual solar production ÷ annual electricity use × 100
Illustration only: for a property using 10,000 kWh per year, 3,000 kWh of solar production is 30% offset; 5,000 is 50%; 8,000 is 80%; 10,000 is 100%; and 11,000 is 110%. These are arithmetic examples, not a proposed system or guaranteed production.
If the usable roof and permitted layout only support an estimated 50% offset, selecting 100% in the diagram does not make that achievable at the property. A roof and production assessment must establish the feasible system, with individual consumption included in the comparison (DOE sizing guidance).
Even 110% energy offset does not guarantee a zero or negative bill: the timing of imports and exports, their different prices, and remaining charges matter (CPUC net billing explanation). Changing the offset below changes solar production only. Storage capacity has its own separate control.
Interactive
See one day, strategy by strategy
Pick a home or a business, choose 30%, 50%, 80%, 100%, or 110% offset, then add storage, switch strategies, and drag the hour slider. The dashed outlines show what the utility meter would see with no battery at that same offset.
Illustrative day
The battery charges only from solar, holds that energy, and discharges during the 4-9 pm window.
- Solar used right away
- Battery discharging
- From the grid
- Battery charging from solar
- Battery charging from grid
- Solar exported
- Grid draw with no battery
During the hour starting at 6 pm: the home uses 4.6 kW, solar makes 1.4 kW, battery discharging 3.2 kW (65% charge left at the end of the hour), and the grid supplies 0.0 kW.
- Grid energy, full day
- 10.0 kWh
- No battery: 22.1 kWh
- Highest grid draw
- 2.4 kW
- No battery: 3.6 kW
- Grid energy, 4-9 pm
- 0.0 kWh
- No battery: 12.0 kWh
- Solar exported
- 0.4 kWh
- No battery: 13.7 kWh
- Solar kept on site
- 99%
- No battery: 59%
- Solar energy offset
- 80%
- Production ÷ usage, not bill savings
What the battery did today
- Solar sent to battery
- 13.3 kWh
- Grid sent to battery
- 0.0 kWh
- Battery supplied to site
- 12.0 kWh
A battery shifts energy; it does not increase solar production or the selected solar offset. Charging and conversion losses mean energy sent in exceeds energy delivered over this repeating day. Grid charging can increase total grid imports while moving them to a different time.
Battery held at 5 kW / 15 kWh across offsets. Solar production scales with the selected offset; usage stays fixed. The no-battery comparison uses the same offset. Solar kept on site includes solar sent into storage and its losses, not the percentage of usage supplied by solar. Battery charging and discharging are each assumed 95% efficient, with no backup reserve or degradation. These are made-up hourly profiles repeated to a stable daily battery cycle, not a seasonal or interval-meter forecast. System size, solar production, and energy consumption vary from one home to the next, so your own results will differ. This is not a quote, a savings estimate, or your rate plan. Hourly steps simplify what utilities measure over shorter windows.
The home and business in the diagram are examples only. Real system size, solar production, and consumption patterns differ for every customer, and they change what each strategy is worth.
Try 30% and then 110% without changing the battery size or strategy. Watch full-day grid imports, midday exports, and the battery charge separately: a higher energy offset is not the same as a higher bill offset. Next, keep one offset and compare No battery with increasing kWh of storage. Then compare Solar-charge 4-9 pm with Demand limit for the business to see whether enough energy remains for the highest demand period. A selected demand limit is a target, not a guarantee.
Homes
The 4-9 pm window
Many Southern California homes are on a time-of-use plan. SCE's TOU-D-PRIME plan has its highest rates from 4 p.m. to 9 p.m. and is open to customers with an electric vehicle, a residential battery, or a heat pump. As of October 2026, SCE lists summer weekday rates of 61 cents per kWh on-peak against 26 cents off-peak, and winter rates (October through May) of 45 cents for 4-9 pm against 24 cents from 8 a.m. to 4 p.m. Rates change, so check SCE's current table.
Solar you export is paid differently. On SCE's Solar Billing Plan, exports earn Energy Export Credits that reflect the value of that electricity to the grid in each hour, with prices fixed for 9 years for new customers. The CPUC says these credits are usually below the retail rate but can rise above it on late summer evenings.
In plain terms: midday solar you export earns a credit set by the grid's value at that hour. Evening power you buy costs the peak rate. A battery lets you move your own solar from the first to the second.
If your battery charges only from solar, it is doing both self-use and 4-9 pm shifting at once. Charging from the grid in the early afternoon is a separate choice that only helps when solar alone cannot fill the battery by 4 p.m.
Meet the equipment
Batteries we install
Our residential storage options include FranklinWH aPower 2, Enphase IQ Battery 5P, and Discover HELIOS ESS. We select the battery, quantity, controls, and compatible equipment for your property rather than treating every battery as interchangeable.
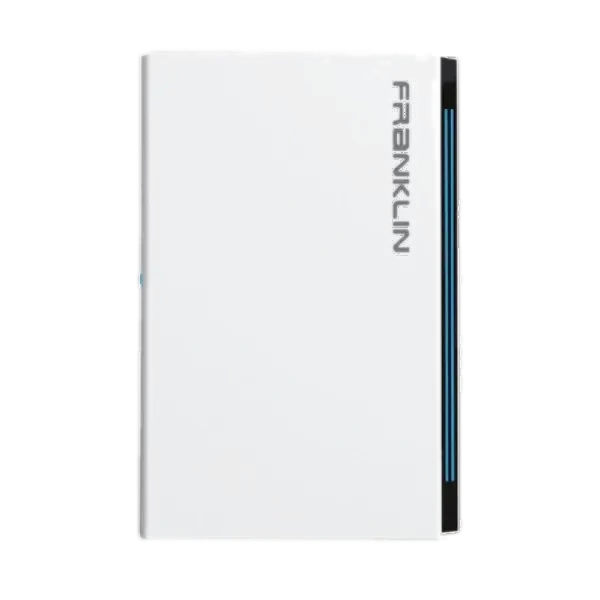
FranklinWH aPower 2
15 kWh
Usable AC energy per unit
10 kW continuous output
AC-coupled storage, with up to 8 kW continuous charging. We size the complete system around the property and its loads.
FranklinWH aPower 2 datasheet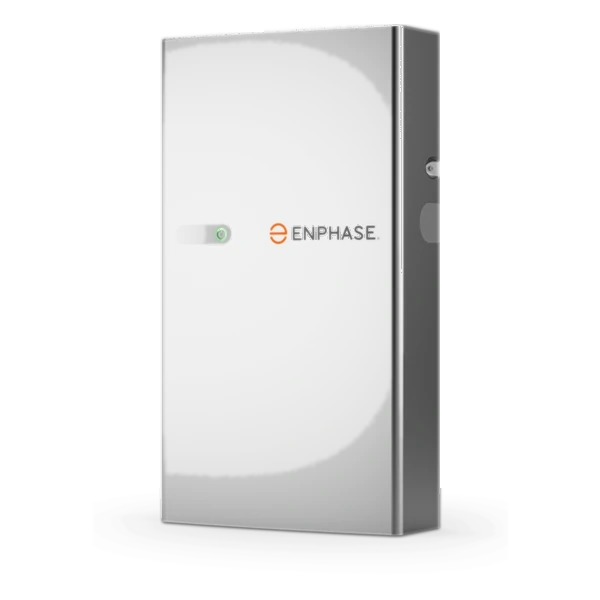
Enphase IQ Battery 5P
5 kWh
Usable energy per unit
3.84 kW continuous output
AC-coupled storage with embedded microinverters. Backup capability requires a compatible IQ System Controller 3/3G configuration.
Enphase IQ Battery 5P specifications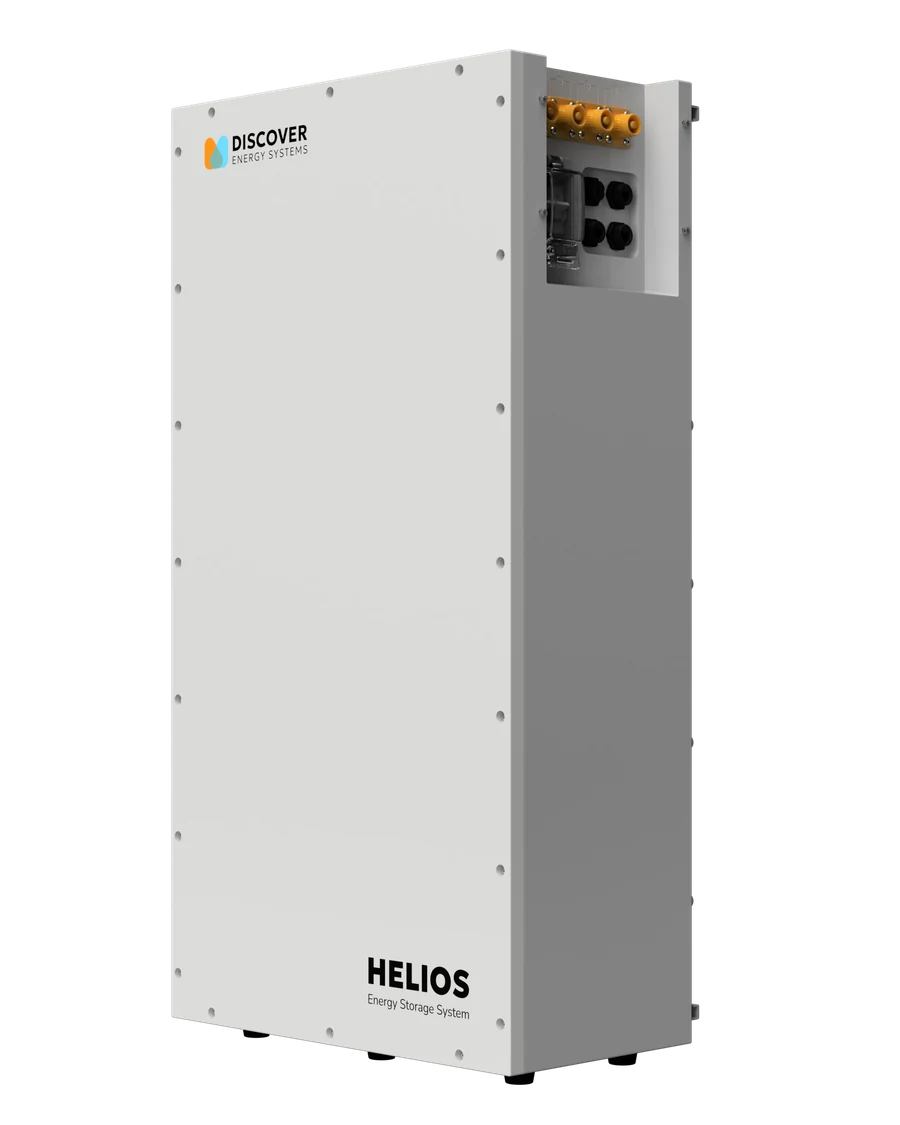
Discover HELIOS ESS
16.08 kWh
Manufacturer-listed usable energy
DC-coupled battery
Designed for integration with a compatible hybrid or battery inverter. Delivered AC power depends on the inverter and complete system design.
Discover HELIOS ESS datasheetCapacity is not a whole-home backup promise. Published capacities use each manufacturer's test conditions and are not a like-for-like estimate of usable energy at your appliances. Installed output, backup loads, reserve settings, temperature, aging, and conversion losses affect the result. Your proposal must confirm the exact model, quantity, compatibility, and equipment required.
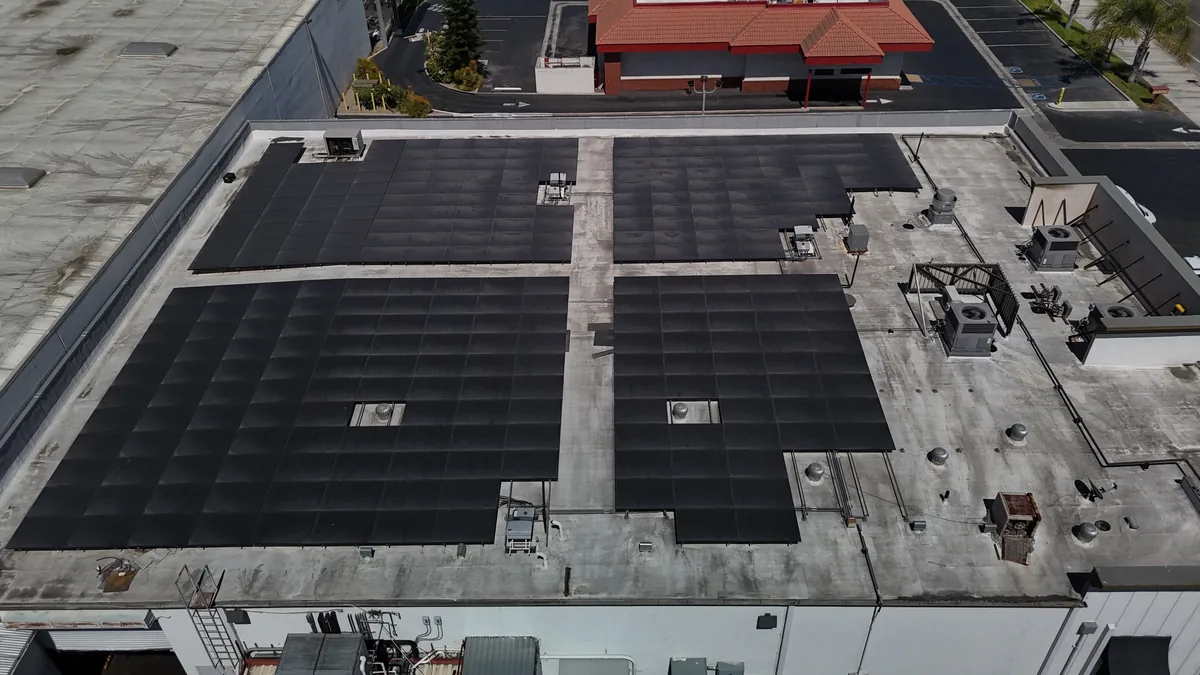
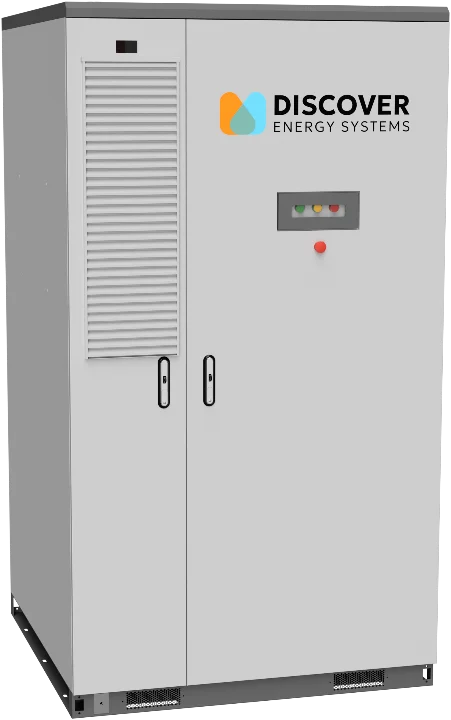
For businesses: commercial storage is custom-engineered for the site's service, interval demand, critical loads, and operating needs. The Business chart is a generic example, not a recommendation to use these residential products or a particular commercial battery. Explore commercial solar and storage.
Businesses
Demand charges: the spike that sets the month
Business rates often bill for power, not just energy. SCE's TOU-GS-3 rate (200 to 500 kW) has four main charges: a monthly customer charge, time-of-use energy charges, a Facilities-Related Demand charge based on the maximum kW in the billing cycle, and a Time-Related Demand charge based on the highest demand during on-peak or mid-peak weekday hours. Larger customers are on TOU-8, which applies above 500 kW.
Peak shaving means the battery discharges when demand approaches a set limit, so the measured peak, and the charge billed on it, is lower. It does not reduce how much energy you use. Utilities measure demand over a short window, often 15 minutes, so check your tariff for the exact interval.
Batteries for demand control are often smaller than people expect. In a simulation of 98 facilities, NREL found that short-duration, small batteries paid back fastest, because the spikes they trim are brief. That study dates from 2015 and is a guide to the logic, not a promise for any one building. Sizing starts with your interval meter data.
Pick a priority. Demand savings and 4-9 pm energy shifting draw on the same battery energy. If the battery empties during the evening, it may miss the very spike that sets the demand charge. A good design models one dispatch schedule instead of adding the two savings together.
Reality check
Why a 100% offset is not a $0 bill
Offsetting 100% of your kilowatt-hours is different from paying nothing. Three things get in the way.
- Fixed charges stay. On TOU-D-PRIME the Base Services Charge is $0.79 per day, roughly $24 a month, whatever your solar produces.
- Exports and imports are priced differently. As above, exports are usually valued below retail, hour by hour.
- Credits are not cash. Under the net billing tariff, bills are due monthly and excess credits roll over until the annual true-up. Leftover net surplus is then credited at a wholesale-based price, not the retail price.
How we say it: designed to offset your electricity costs. Most customers still pay some fixed charges. Results depend on your rate plan, your system size and solar production, your energy consumption, and how and when you use power.
Your utility matters
SCE, Riverside Public Utilities, and others
- SCE: net billing plus time-of-use plans, as described above. Not sure which billing plan you are on? Use our NEM status guide.
- Riverside Public Utilities: a separate municipal utility with its own solar program. RPU lets customers offset up to 150% of their historical 12-month energy use. Do not apply SCE rules to an RPU account. We confirm your actual rate and export treatment at the complimentary assessment.
- Other utilities: rules differ, so ask us before relying on any number from this page.
Money back
Incentives and tax
- Businesses: Section 48E covers energy storage technology, at 6% as a base rate and 30% in listed cases, such as capacity under 1 megawatt or when prevailing wage and apprenticeship rules are met. The statute does not restrict what charges the battery. Run the Section 48E eligibility screen for a first look.
- Homeowners: the federal 25D residential credit ended on January 1, 2026. See financing and incentives for what still applies.
- Your quote: we price batteries on bill savings and outage backup alone, with no rebates assumed.
This is general information, not tax, legal, or financial advice.
Questions
Common questions
Want to see how this plays out for your own home or building? Request a complimentary assessment and we will check your actual rate plan first.
Important: This guide is general information. System size, solar production, and energy consumption depend on each customer's roof, equipment, weather, and usage habits, and savings depend on your utility, rate plan, and how you use power. Rates, programs, and incentives change. Examples and diagrams are illustrative and are not a quote, a guarantee of savings, or tax, legal, or financial advice.